In Fig. 367 you can see the basic design structure of the VA design for the calculation of the HOG feature. For a grayscale image from a camera in CameraLink base configuration the Histogram of Oriented Gradients is calculated in the HierarchicalBox HOG. This histogram is sent to PC via DMA in the design "HOG_9Bins_Histogram.va". In the VA designs "HOG_4Bins_HistogramMax.va" and "HOG_9Bins_HistogramMax.va" the maximum component is forwarded to PC. In the following we explain the design structure of "HOG_4Bins_HistogramMax.va". It is analog for the other two designs. We explain possible differences in the designs for the corresponding issues. The default platform is marathon VCL. The design implementations can easily adapted to other platforms or camera configurations.
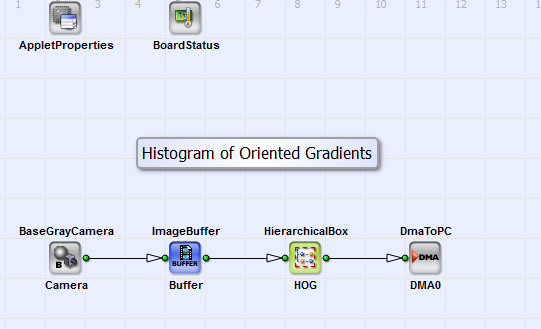
Figure 367. Basic Design structure of the VA designs "HOG_9Bins_Histogram.va","HOG_9Bins_HistogramMax.va" and "HOG_4Bins_HistogramMax.va"
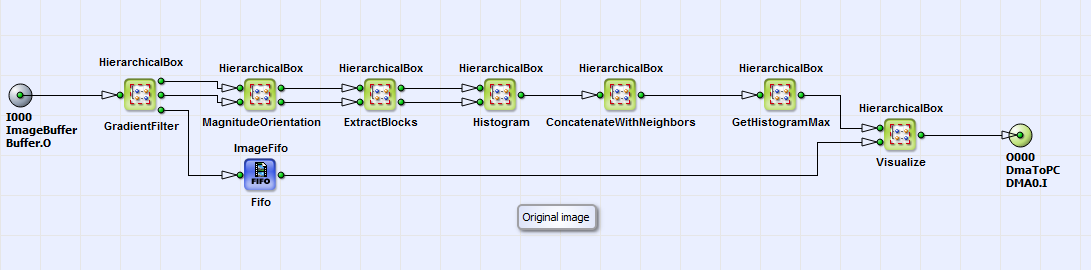
You can see the content of the HierarchicalBox HOG in Fig. 368.
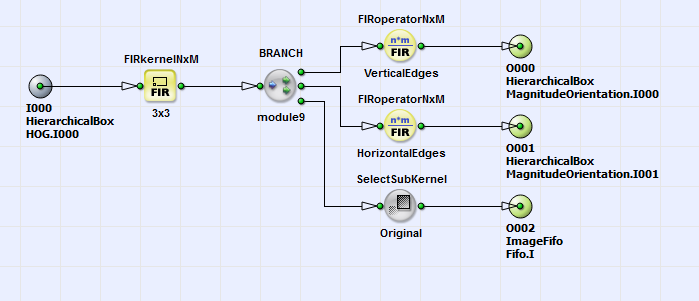
For the original input image the gradients in x- and y- direction are calculated in the HierarchicalBox GradientFilter. The implementation is shown in Fig. 47. The operator FIRkernelNxM generates a 3x3 kernel. The operators FIRoperatorNxM_VerticalEdges and FIRoperatorNxM_HorizontalEdges select according to eq. 47 the gradients in x- and y-direction.
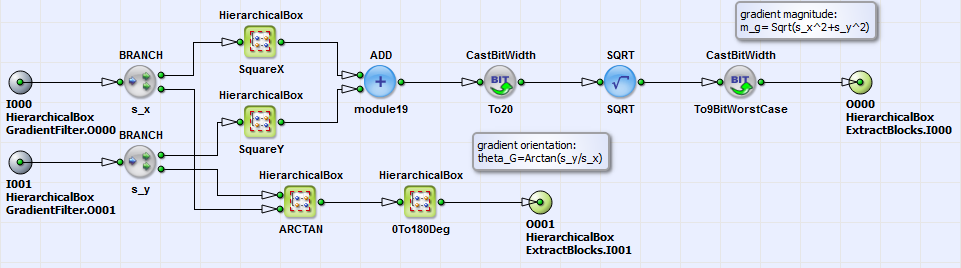
For this gradients the magnitude and orientation according to eq. 48 is implemented in the box MagnitudeOrientation (content and structure see Fig. 370).Detailed comments in the box help to understand the implemented formula.
The grouping of the pixels in cells of 8x8 pixels is performed in the HierarchicalBox ExtractBlocks. The output links of this box forward the gradient magnitude and orientation of the cells in form of lines of size 64 pixels. This information is input for the calculation of the Histogram of Oriented Gradients, which is performed in the HierarchicalBox Histogram. You can see its content in Fig. 371.
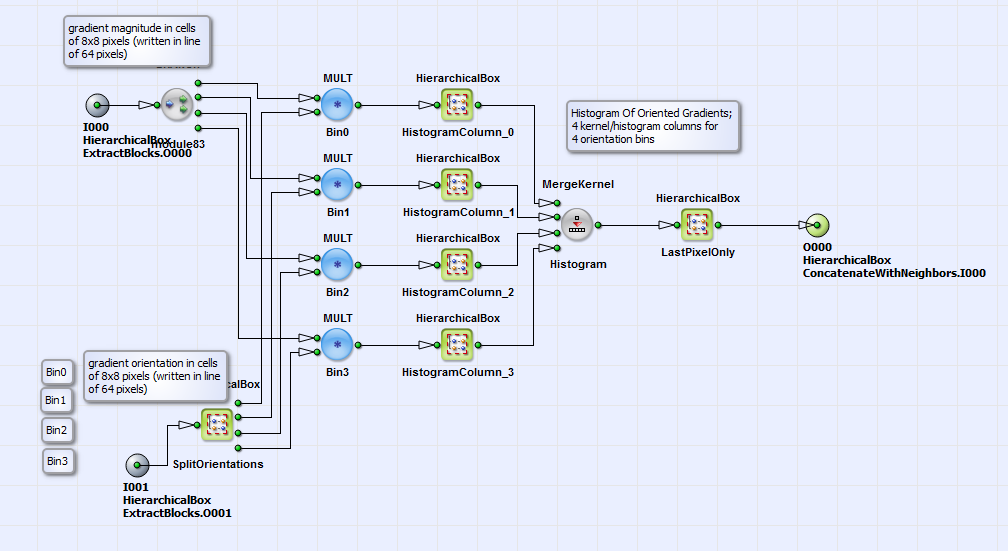
Here an assignment of the gradient orientations, which can be in a region of
 to
to
 , to four bins is performed
in the box SplitOrientations. The bins are
, to four bins is performed
in the box SplitOrientations. The bins are  ,
,
 ,
,
 and
and
 .
For the designs "HOG_9Bins_Histogram.va" and "HOG_9Bins_HistogramMax.va" nine bins (
.
For the designs "HOG_9Bins_Histogram.va" and "HOG_9Bins_HistogramMax.va" nine bins (
 to
to
 in steps of
 ) exist.
The assignment of the gradient orientation to a certain bin
is done the way, that a weight of this orientation for the bin is calculated. As an example the weighting and therefor
assignment to bin 1, which is
) exist.
The assignment of the gradient orientation to a certain bin
is done the way, that a weight of this orientation for the bin is calculated. As an example the weighting and therefor
assignment to bin 1, which is
 , is shown in Fig.
372.
, is shown in Fig.
372.
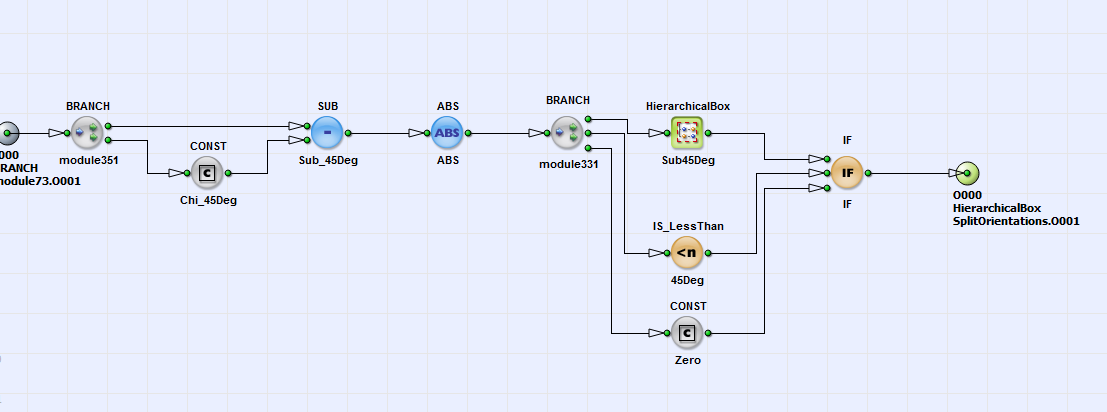
Here the weight  according to eq.
49 is calculated for bin 1. The angle distance
according to eq.
49 is calculated for bin 1. The angle distance
 between the bins is in this example
 (operator CONST_Phi_45Deg in
box Sub45Deg). The angle bin orientation for bin 1
(operator CONST_Phi_45Deg in
box Sub45Deg). The angle bin orientation for bin 1
 is also
 (operator CONST_Chi_45Deg). The weighting
factor for each bin is then multiplied with the gradient magnitudes (see Fig. 371). In the boxes
HistogramColumn_0 to HistogramColumn_3 the content of each histogram column (for each bin) according to eq.
50 is calculated as the sum of the weighted gradient magnitudes over all image pixels. The Histogram of
Oriented Gradients is then generated with merging the histogram columns with the operator MergeKernel_Histogram.
Only the last pixel of each kernel component is the true value of the histogram columns, so it is selected in the box
LastPixelOnly. To account for
local gradient changes the Histogram of Oriented Gradients for each cell is combined to blocks of size 2x2 cells per block
with an overlap of
(operator CONST_Chi_45Deg). The weighting
factor for each bin is then multiplied with the gradient magnitudes (see Fig. 371). In the boxes
HistogramColumn_0 to HistogramColumn_3 the content of each histogram column (for each bin) according to eq.
50 is calculated as the sum of the weighted gradient magnitudes over all image pixels. The Histogram of
Oriented Gradients is then generated with merging the histogram columns with the operator MergeKernel_Histogram.
Only the last pixel of each kernel component is the true value of the histogram columns, so it is selected in the box
LastPixelOnly. To account for
local gradient changes the Histogram of Oriented Gradients for each cell is combined to blocks of size 2x2 cells per block
with an overlap of
 (see theory part of this section). The combination of the cells
to blocks is performed in the box ConcatenateWithNeighbors. See its content in Fig.
373.
(see theory part of this section). The combination of the cells
to blocks is performed in the box ConcatenateWithNeighbors. See its content in Fig.
373.
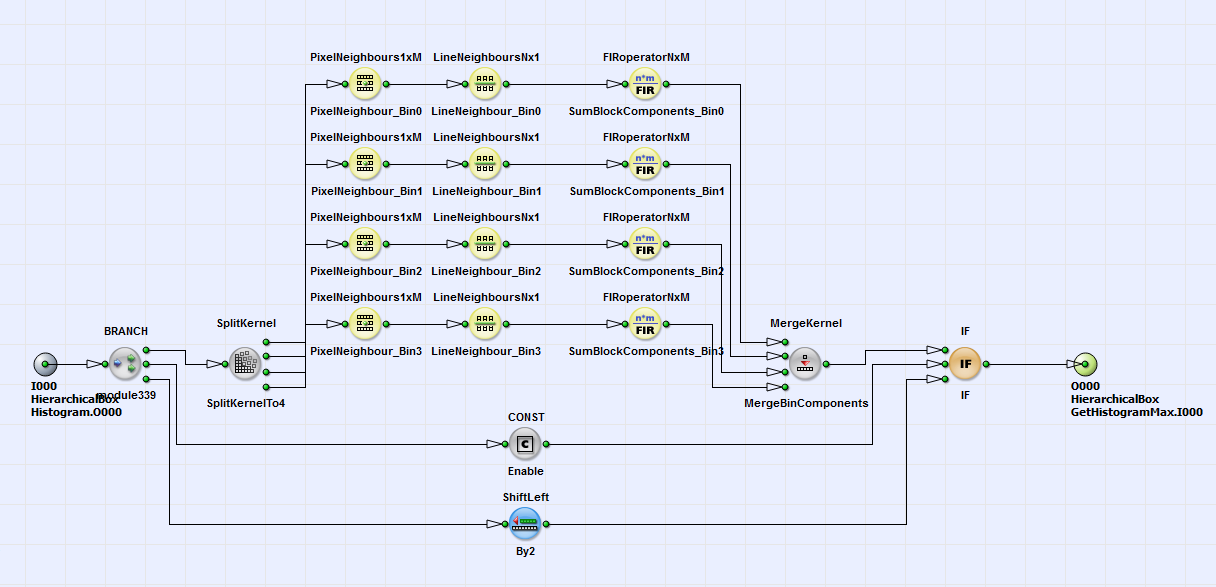
For each cell (represented by a single pixel) with information about the Histogram of Oriented Gradients, the histogram columns for each bin are separated with the operator SplitKernel. For each kernel component the next cell neighbors in x and y- direction are calculated with the operators PixelNeighbours1xM and LineNeighboursNx1.The operator FIRoperatorNxM sums the information of the 2x2 cells up. No normalization is performed here. As an alternative implementation the grouping of the cells to blocks can be omitted by setting the operator Const_Enable to zero. The maximum of the calculated Histogram of Oriented Gradients is selected in box GetHistogramMax (see Fig. 368). Its content is shown in Fig. 374. In the design "HOG_9Bins_Histogram.va" the selection of the histogram maximum is omitted.
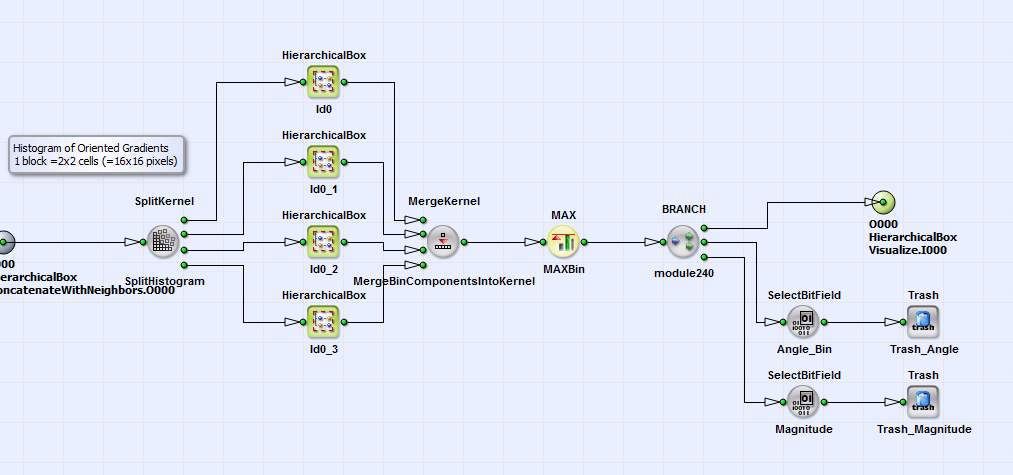
Finally the maximum of the histogram or the histogram itself is visualized in box Visualize (see Fig 368) as red lines. In this box (path: box Draw, EnableOriginal) you have the possibility to visualize the original image for a number of frames together with the HOG feature by setting the parameters ModuloCount_Period (counts frames), Is_InRange (set frame range) and Const_Enable or always (setting Const_Enable to one). As last step the HOG feature is transferred to PC via the operator DmaToPC_DMA0. Here the HOG feature can be used as descriptor for object detection in Support Vector Machines (SVP) or also Convolutional Neural Networks (CNN).
